Golf Course Project: A Case Study
Turf Health Analysis by Drone Surveying: A Case Study
The marvel about using a drone to capture imagery is the extremely high quality that can be captured compared to other methods.
It is important for golf course operators to know:
1
Health
Health of turf and vegetation.
3
Erosion
Identify changes in areas impacted by erosion.
2
Drainage
Identify areas of concern where drainage may be an issue.
4
Damage
Survey for damage to property and vegetation after storms.
Traditionally golf course operators would use satellite imagery, such as Google Earth, or hire an aircraft to conduct an aerial survey of the golf course property. These traditional methods can be both costly and time consuming. With the introduction of drone technology the same insight can be provided at a lower cost, making it far more beneficial to the golf course operators.
Using a drone to capture the data allows the golf course operator to receive up-to-date information on the health of turf and vegetation through the use of a Normalized Difference Vegetation Index (NDVI). The high quality bird’s eye view of the golf course can provide insight into areas which may be susceptible to soil erosion and areas damaged by storms, as well as areas for potential future expansion.
Background
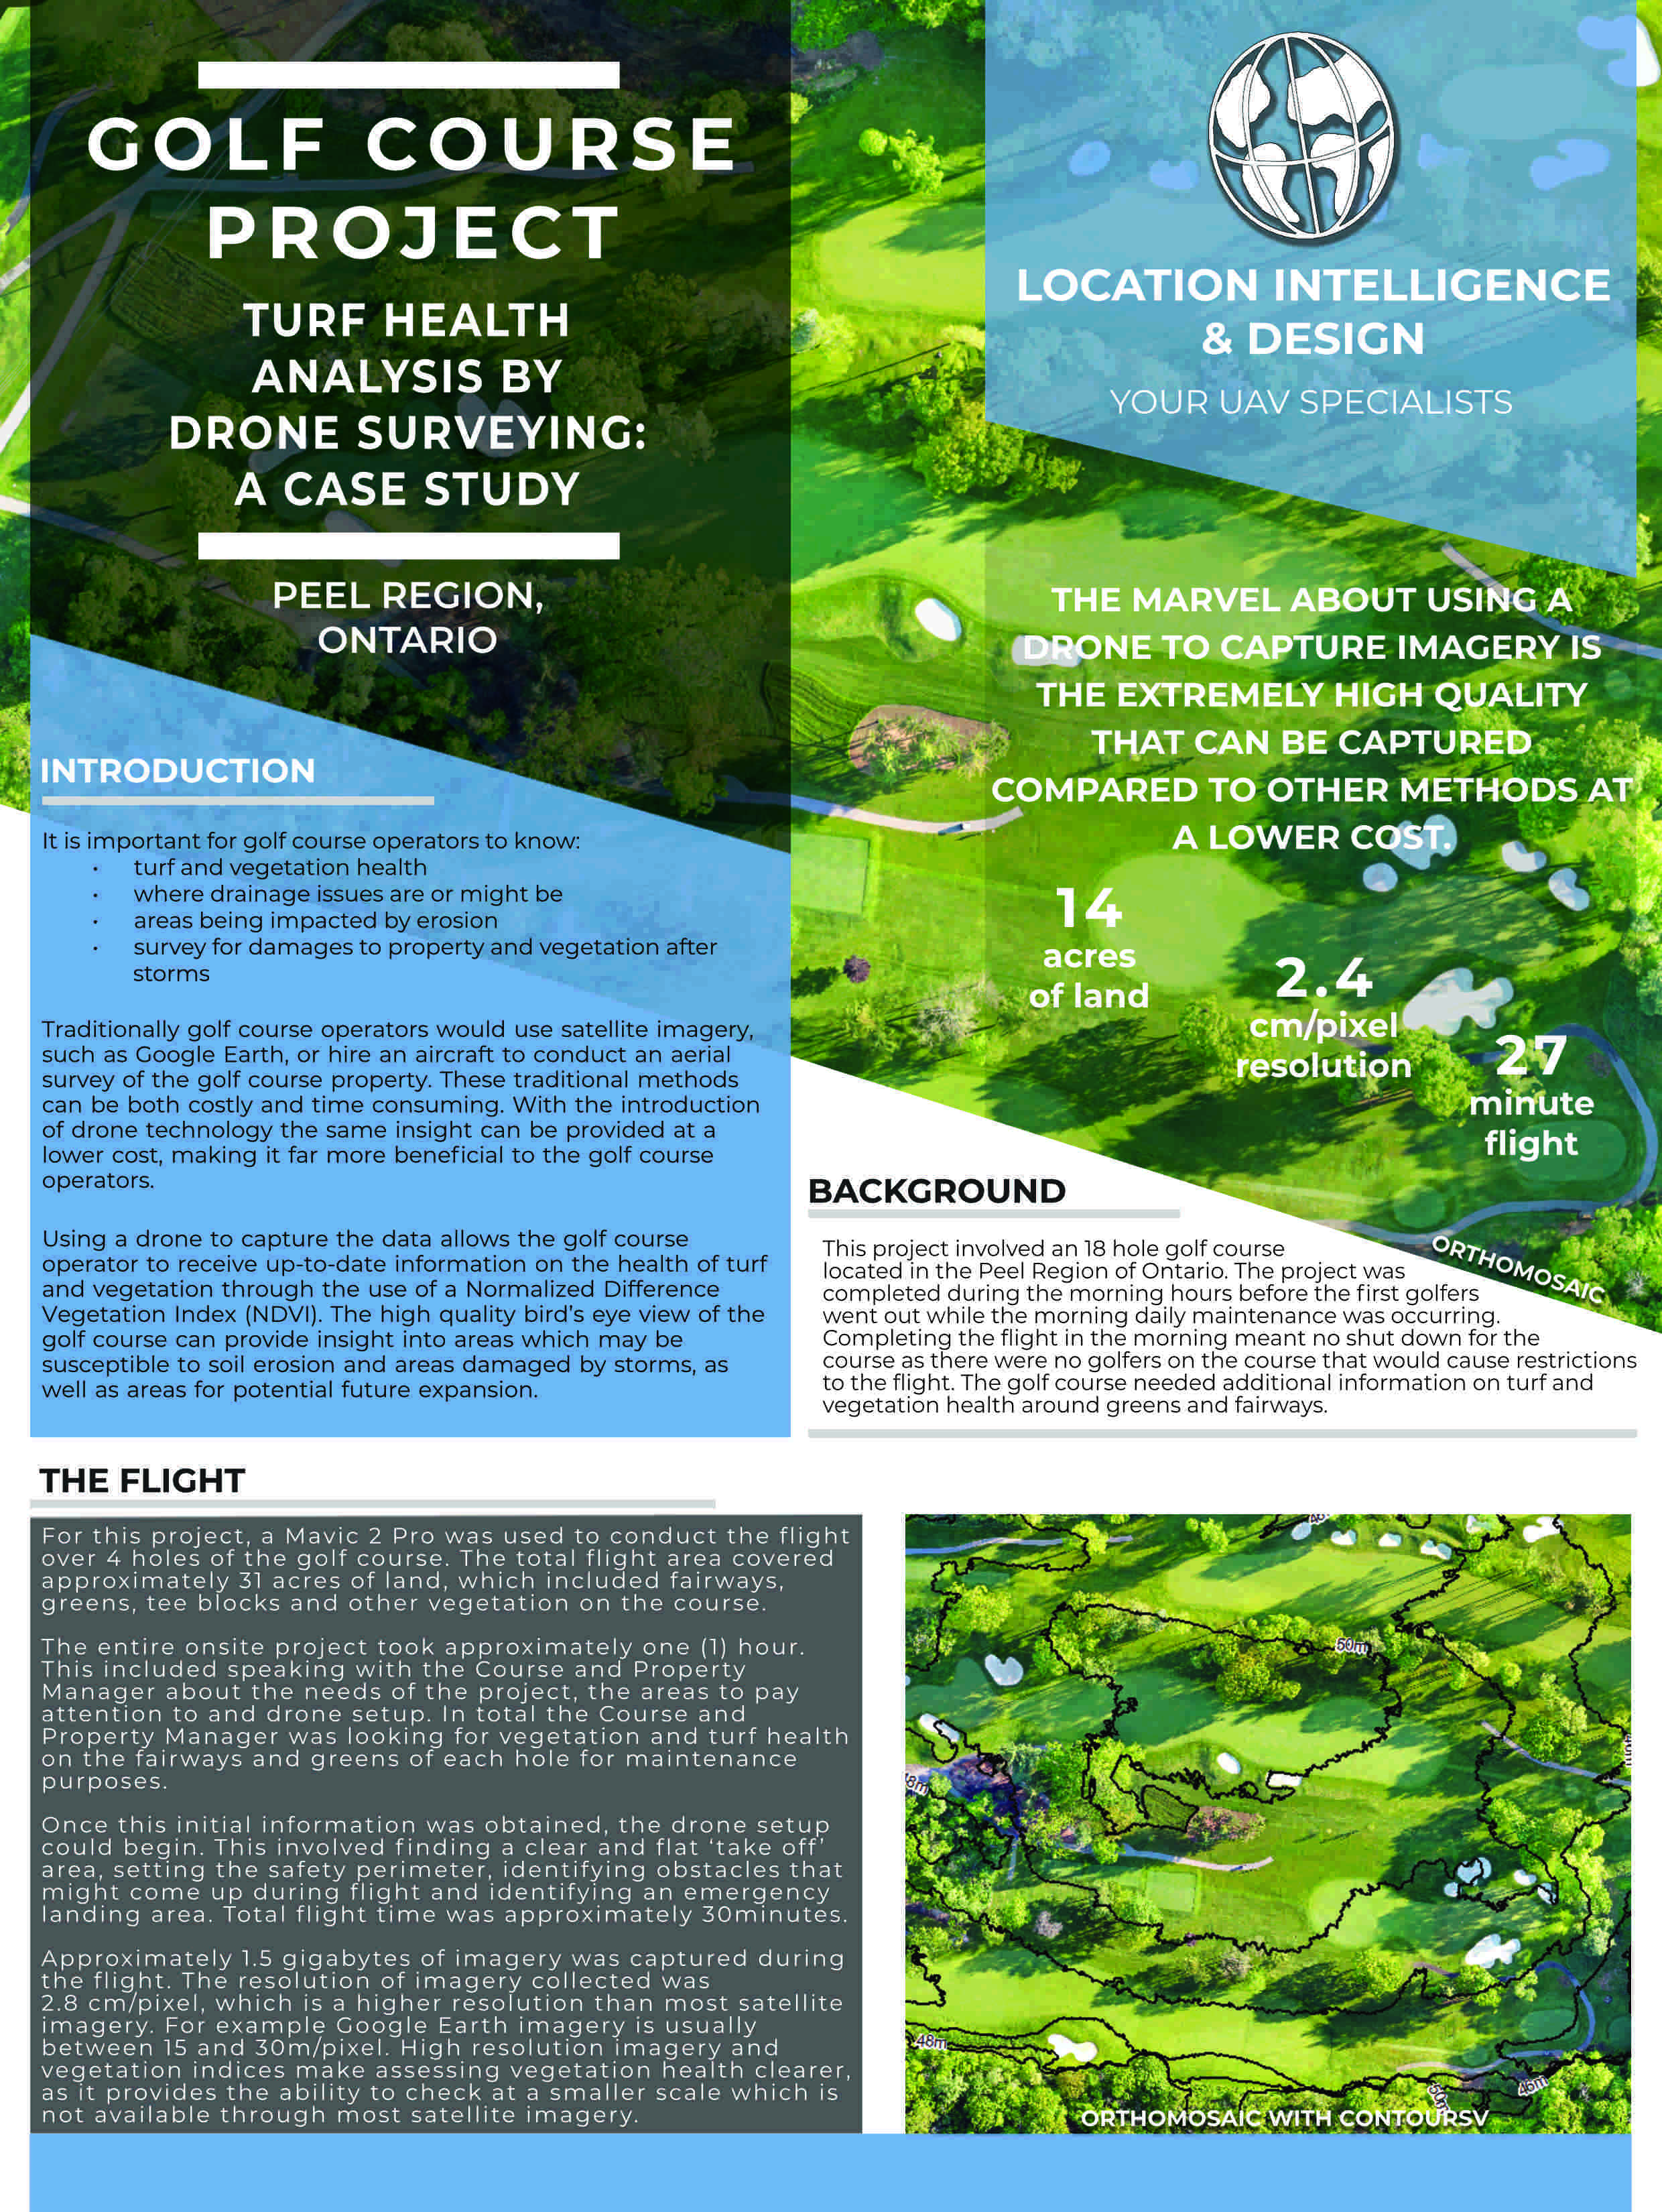
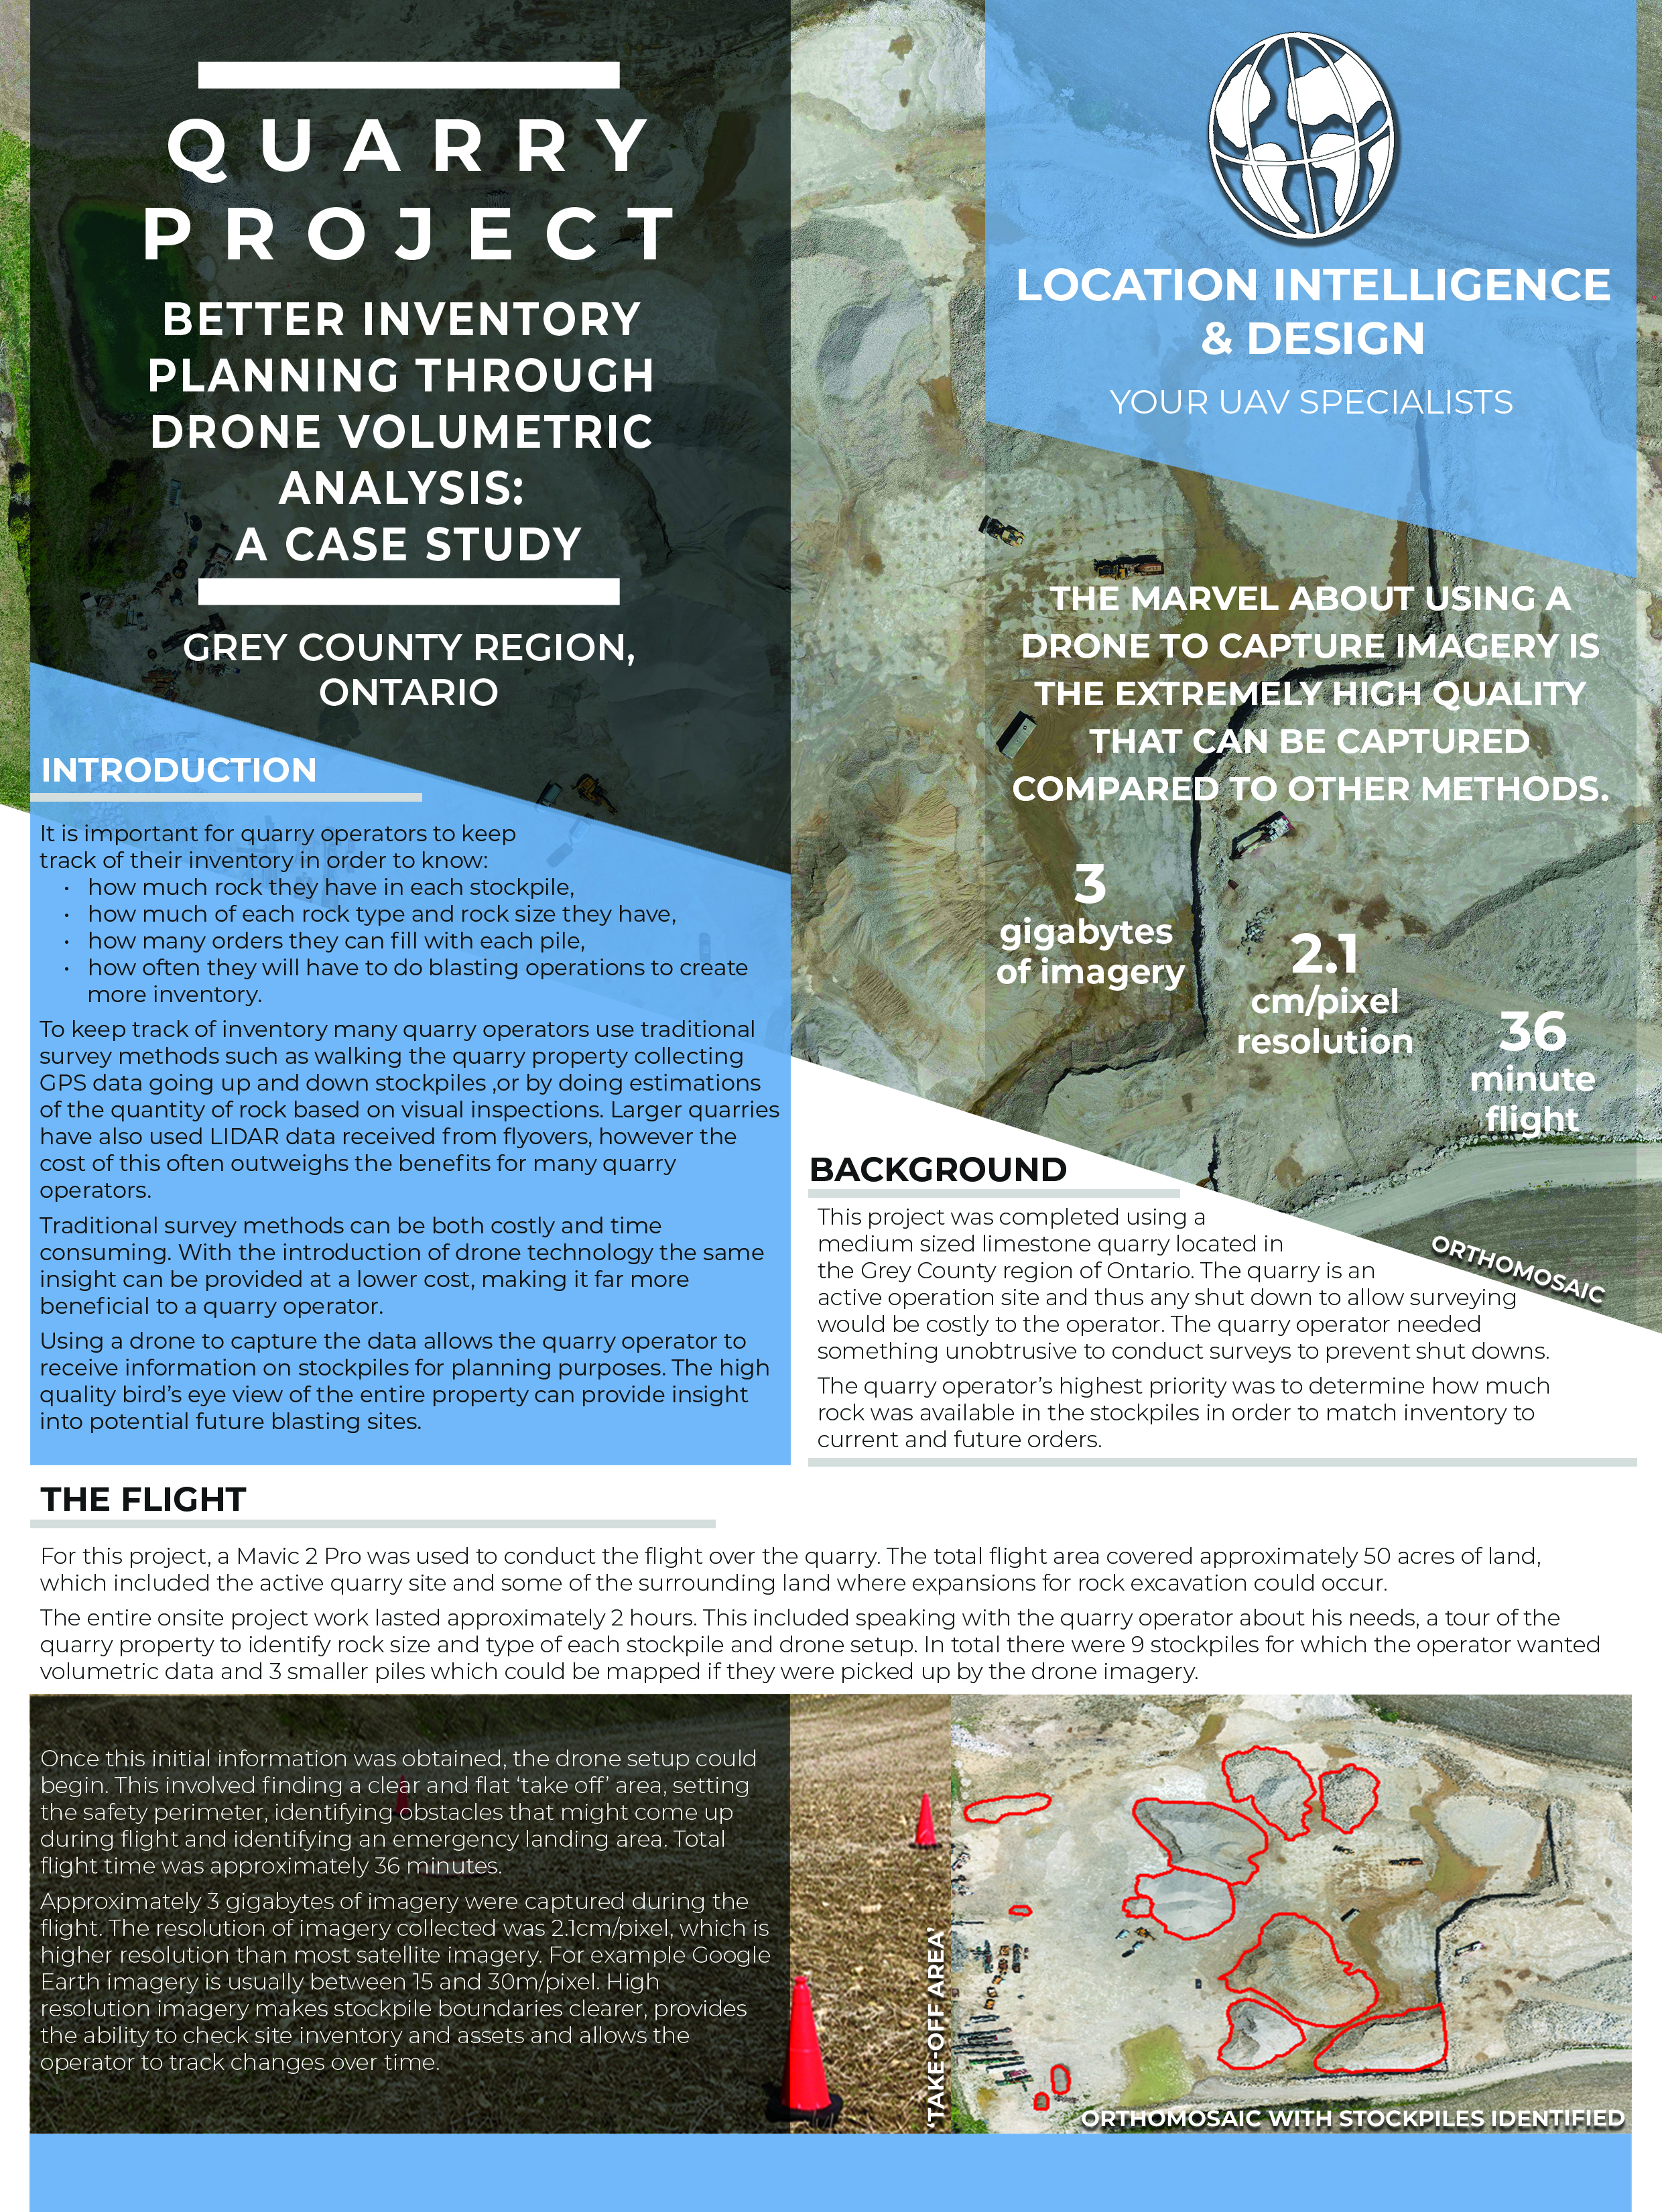
This project involved an 18 hole golf course located in the Peel Region of Ontario. The project was completed during the morning hours before the first golfers went out while the morning daily maintenance was occurring.
Completing the flight in the morning meant no shut down for the course as there were no golfers on the course that would cause restrictions to the flight. The golf course needed additional information on turf and vegetation health around greens and fairways.
The Flight
For this project, a Mavic 2 Pro was used to conduct the flight over 4 holes of the golf course. The total flight area covered approximately 31 acres of land, which included fairways, greens, tee blocks and other vegetation on the course.
The entire onsite project took approximately one (1) hour. This included speaking with the Course and Property Manager about the needs of the project, the areas to pay attention to and drone setup. In total the Course and Property Manager was looking for vegetation and turf health on the fairways and greens of each hole for maintenance purposes.
2.8
Resolution
2.8 cm/pixel
31
Acres
31 acres of land
30
Flight Time
2 batteries on Mavic 2 Pro
Pre-flight
Once this initial information was obtained, the drone setup could begin. This involved finding a clear and flat ‘take off’ area, setting the safety perimeter, identifying obstacles that might come up during flight and identifying an emergency landing area. Total flight time was approximately 30minutes.
Approximately 1.5 gigabytes of imagery was captured during the flight. The resolution of imagery collected was 2.8 cm/pixel, which is a higher resolution than most satellite imagery. For example Google Earth imagery is usually between 15 and 30m/pixel. High resolution imagery and vegetation indices make assessing vegetation health clearer, as it provides the ability to check at a smaller scale which is not available through most satellite imagery.

What do you do with all that data?
Using the drone to collect the data is the easy part! Knowing what to do with it requires detailed skill and knowledge. Processing and understanding the data becomes complex when dealing with large datasets.
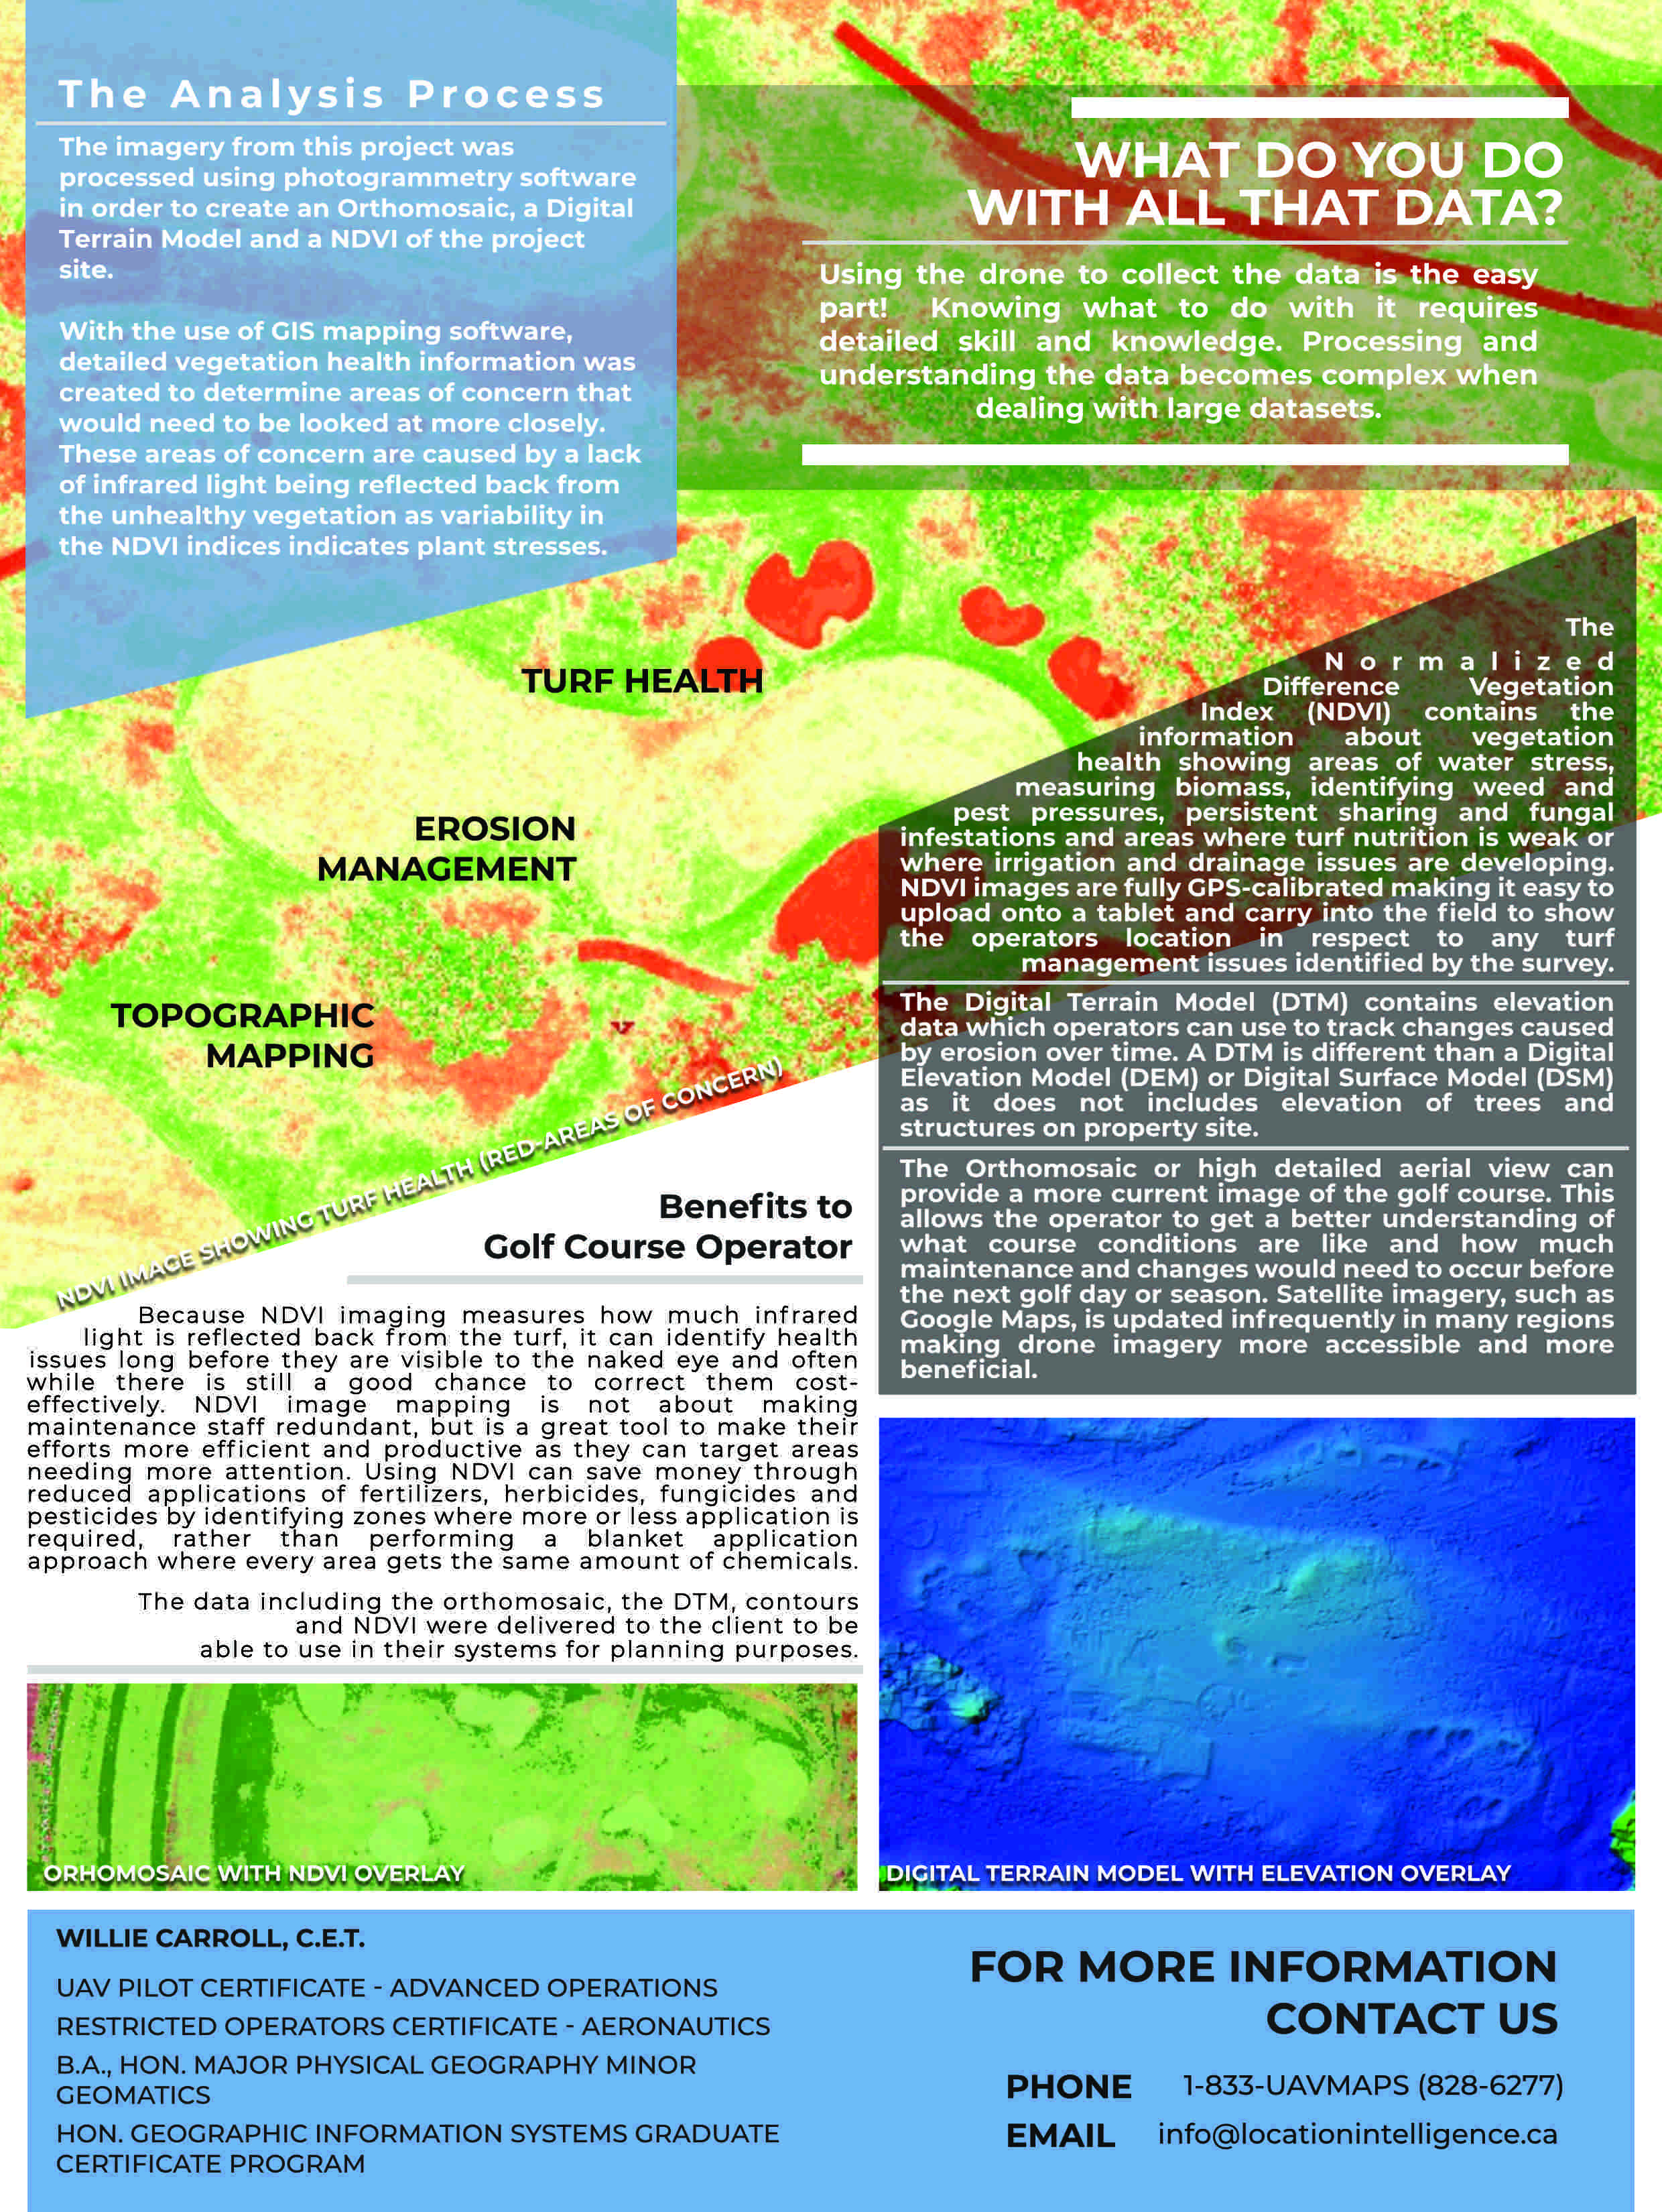
The imagery from this project was processed using photogrammetry software in order to create an Orthomosaic, a Digital Terrain Model and a NDVI of the project site.
The Analysis Process:
With the use of GIS mapping software, detailed vegetation health information was created to determine areas of concern that would need to be looked at more closely. These areas of concern are caused by a lack of infrared light being reflected back from the unhealthy vegetation as variability in the NDVI indices indicates plant stresses.
Topographic Mapping

Turf & Vegetation Health

Erosion Management
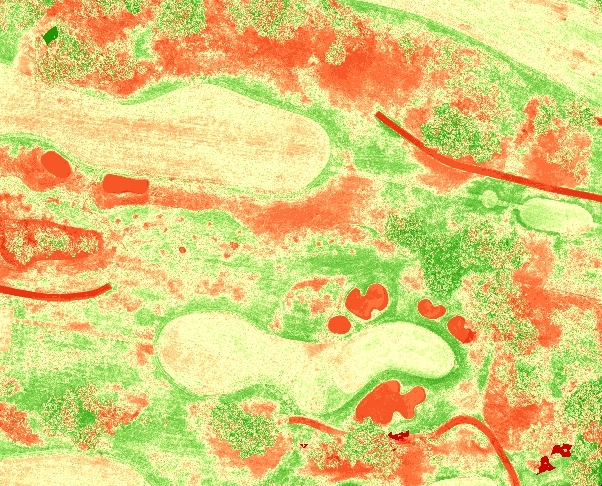
Turf Health Analysis through NDVI
The Normalized Difference Vegetation Index (NDVI) contains the information about vegetation health showing areas of water stress, measuring biomass, identifying weed and pest pressures, persistent sharing and fungal infestations and areas where turf nutrition is weak or where irrigation and drainage issues are developing. NDVI images are fully GPS-calibrated making it easy to upload onto a tablet and carry into the field to show the operators location in respect to any turf management issues identified by the survey.
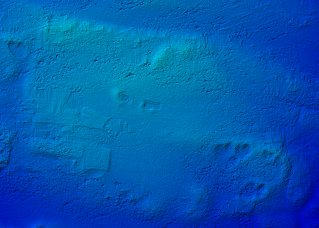
Digital Terrain Model
The Digital Terrain Model (DTM) contains elevation data which operators can use to track changes caused by erosion over time. A DTM is different than a Digital Elevation Model (DEM) or Digital Surface Model (DSM) as it does not includes elevation of trees and structures on property site.
Benefits to Golf Course Operator
Because NDVI imaging measures how much infrared light is reflected back from the turf, it can identify health issues long before they are visible to the naked eye and often while there is still a good chance to correct them cost-effectively. NDVI image mapping is not about making maintenance staff redundant, but is a great tool to make their efforts more efficient and productive as they can target areas needing more attention. Using NDVI can save money through reduced applications of fertilizers, herbicides, fungicides and pesticides by identifying zones where more or less application is required, rather than performing a blanket application approach where every area gets the same amount of chemicals.
The data including the orthomosaic, the DTM, contours and NDVI were delivered to the client to be able to use in their systems for planning purposes.